
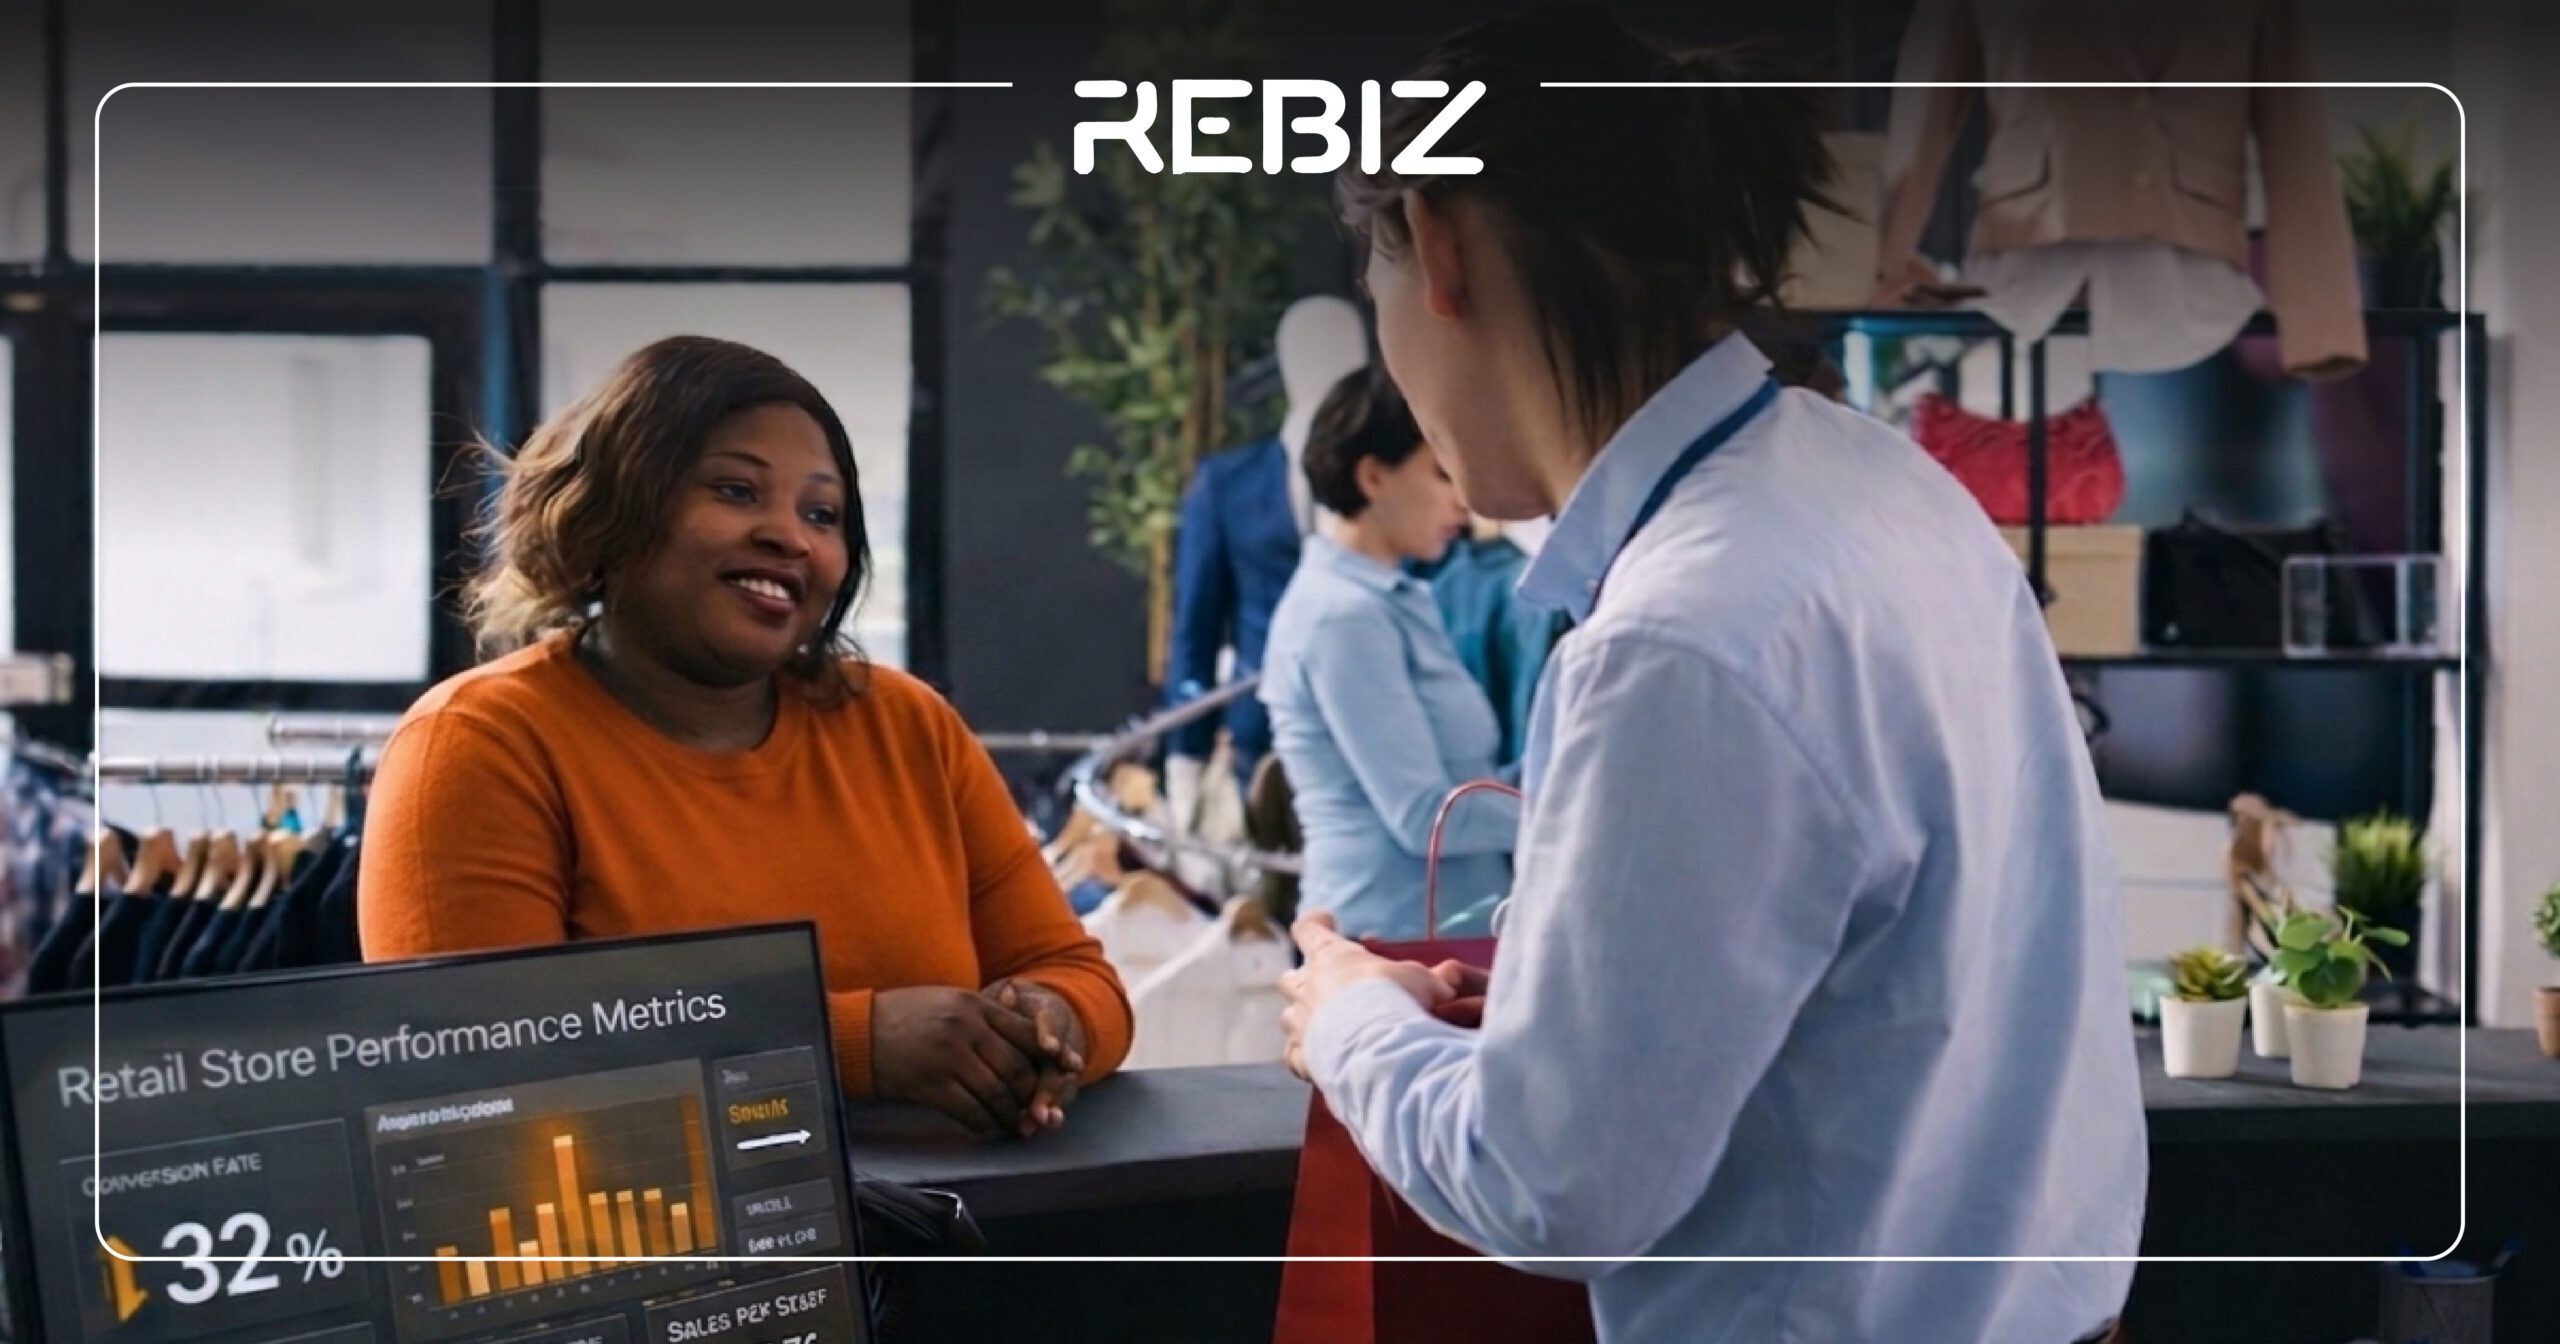
Most retail store performance metrics look solid on paper. Revenue is up. Average order value (AOV) remains steady. Monthly sales targets are met.
But none of these numbers tells you what happens between the moment a customer walks in and when they check out.
For wireless retailers, understanding what happens on the sales floor is crucial to uncovering inefficiencies and capturing hidden opportunities. Traditional metrics are good for measuring results, but they fail to explain the why behind those results.
To optimize performance, you need visibility into the real dynamics of customer behavior and staff engagement, the critical data points that are often missed by outdated metrics.
Key Overview
- Traditional Retail Store Performance Metrics like revenue and AOV don’t capture in-store behaviors like customer engagement and staff performance.
- New KPIs to track in 2026 include floor conversion rate, engagement rate, and assisted vs. unassisted sales, which provide real-time visibility into store operations.
- Retail Analytics Software offers actionable insights that can optimize staffing, improve sales performance, and increase in-store conversion.
- Retail Operations Monitoring with integrated tools like ReBiz helps operators address inefficiencies and drive higher profitability across multiple store locations.
- Advanced retail analytics software, like ReBiz, helps bridge the gap by integrating traffic, staffing, and sales data to provide a more complete view of store performance.
The Retail Metrics Most Stores Rely On
Most operators rely on these key retail store performance metrics:
- Revenue
- Average order value (AOV)
- Units per transaction
- Sales per associate
- Monthly sales targets
These KPIs can be helpful, but they are also lagging indicators. They tell you what happened after the fact. For example, they may show you total revenue or sales per associate, but they don’t explain why some customers leave without purchasing or why conversion rates fluctuate.
These figures don’t address operational challenges that may impact sales performance. Without better visibility into customer interactions and team responses, you can’t pinpoint the real causes of underperformance.
The Blind Spot – What Happens on the Floor
Most retail store performance metrics overlook what occurs on the sales floor between customer entry and checkout. Retailers often fail to track customer engagement, staff efficiency, and interaction quality.
Walk-ins vs. Engagement
Raw traffic counters show how many people enter, but they don’t distinguish verified customer presence or whether those customers were engaged. If customers are not greeted or assisted, they may leave without purchasing. This gap between walk-ins and engagement is a significant blind spot for retailers.
Idle Time and Coverage Gaps
Staff productivity depends on being available when the store needs them most, not just being present. Fluctuating traffic can lead to missed sales if coverage is insufficient during peak times. Traditional metrics rarely track staff idle time or identify coverage gaps.
Lost Sales from Delayed Assistance
Wireless customers typically walk in with a need. Whether it’s upgrading their plan or purchasing a new phone, timely assistance is crucial. If staff delay in greeting or helping customers, the likelihood of conversion drops significantly. Unfortunately, traditional metrics don’t track wait times or the impact of delays on conversion, so this gap often goes unnoticed.
Inconsistent Upselling
Staff can vary significantly in their ability to upsell accessories or additional products, which directly affects the AOV and revenue. If one associate is much more effective at closing upsell opportunities than others, this can skew average sales metrics without revealing the underlying cause: inconsistent sales strategies across the team.
Why POS Data Alone Isn’t Enough
Your POS system is essential, but it’s not enough to get the full picture.
POS data shows you what happened after the transaction was completed. It provides valuable insights such as:
- What items were sold
- At what price
- By which associate
- During which time frame
But it does not capture:
- How many customers entered without purchasing
- How long customers waited before engaging with staff
- Whether your staff’s behavior matched the store’s needs
- If certain sales opportunities were missed because of poor engagement or delayed assistance
This gap in operational insight is why many retailers struggle to identify the reasons behind sales fluctuations until it’s too late.
The Retail Store Performance Metrics That Actually Matter in 2026
To optimize sales performance, retailers should look beyond revenue and sales per associate. In 2026, the most effective retail store performance metrics are proactive and behavior-driven, focusing on actions that directly influence sales and identify areas for improvement before revenue declines.

Floor Conversion Rate
Instead of tracking total sales per visit, floor conversion rate measures how many customers who engage with staff make a purchase. This helps operators assess how effectively their team converts walk-ins into sales.
Engagement Rate
Engagement rate tracks the number of customers actively assisted by staff during their visit. This metric reveals gaps in team interactions and identifies associates who may need additional training or support.
Assisted vs Unassisted Sales
Analyzing the ratio of assisted to unassisted sales highlights where associates may miss upselling or cross-selling opportunities. A high rate of unassisted sales suggests staff interactions could be improved.
Sales Velocity by Hour
Sales velocity, or revenue per hour, is another valuable metric that can highlight performance trends across the day. It tracks how quickly your store generates sales during peak hours, helping you identify times of day when sales are lagging and adjust staffing and floor coverage accordingly.
How Advanced Retail Analytics Can Close the Gap
Modern retail analytics software bridges the gap between POS data and actionable insights. By consolidating traffic, staffing, and sales data into one dashboard, tools like ReBiz offer a comprehensive view of store performance.
This integrated approach allows you to:
- Identify when traffic spikes exceed staffing capacity.
- Detect when staff are underperforming or idle during critical hours.
- Highlight missed upsell opportunities or slow response times.
Aligning operational behaviors with sales performance helps retailers address the root causes of low conversion rates and missed sales opportunities.
What High-Performing Wireless Retailers Do Differently
Top wireless retailers don’t just track lagging performance metrics. They proactively monitor behavior-level KPIs:
- They focus on engagement metrics, not just revenue
- They track floor conversion and engagement rates in addition to sales per associate
- They ensure staff are properly trained and available during peak traffic times
- They align staffing to verified customer traffic patterns and adjust coverage when conversion gaps appear.
- They use predictive insights to optimize performance, not just react to results
By treating retail store performance metrics as tools for continuous improvement rather than end-of-day reports, these retailers stay ahead of the curve and drive long-term growth.
Conclusion
If you’re only tracking traditional retail store performance metrics, you’re only seeing part of the picture.
Sales figures are the result. Execution on the floor; customer engagement, staff behavior, and coverage alignment is the driver.
By embracing more actionable KPIs, like engagement rates, floor conversion, and traffic-to-staff ratios, and investing in advanced retail analytics, you can uncover the hidden opportunities and inefficiencies that are limiting your store’s growth.

FAQ
1. What are the top retail store performance metrics to track for improving sales?
Track floor conversion rate, engagement rate, traffic-to-staff ratio, and assisted vs. unassisted sales to improve customer interaction, staffing efficiency, and ultimately, sales performance.
2. What are the key metrics for evaluating retail store profitability?
Key profitability metrics include gross profit margin, sales per square foot, average order value (AOV), and revenue per employee to evaluate cost efficiency, sales productivity, and overall store profitability.
3. What are the top solutions for integrating POS data into retail performance reports?
Solutions like ReBiz, Lightspeed POS, Vend POS, and Square for Retail integrate POS data into performance reports, providing insights into sales, customer engagement, and staffing to improve decision-making.
4. What are the best software tools for analyzing retail store performance metrics?
Best tools include ReBiz, Shopify Analytics, Salesforce Retail Analytics, and Katanacuts, offering real-time data analysis, performance tracking, and insights to improve retail store operations and sales growth.
5. What key performance indicators (KPIs) are used by successful retail chains?
Successful retailers track customer conversion rate, sales per associate, customer engagement metrics, and retention rate to optimize sales performance, evaluate staff effectiveness, and ensure consistent store execution.

